Current Wind & Wave Forecast
Most recent wave forecast plots.
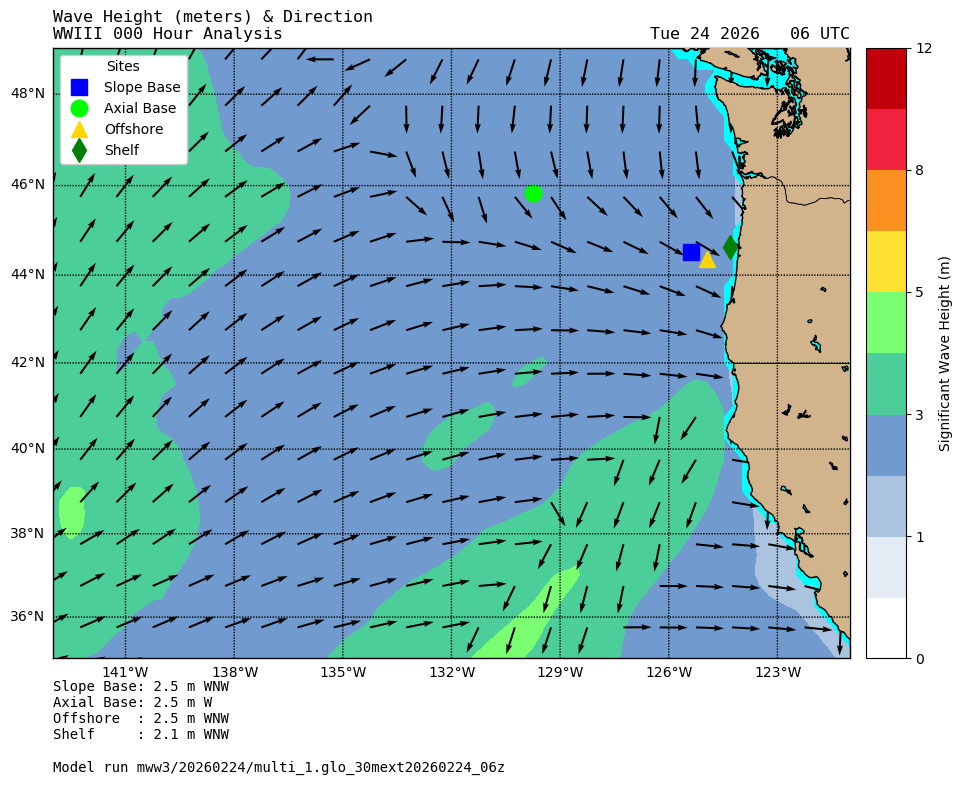
The image below shows a map of significant wave height (coloring) and primary wave direction vectors (arrows; not scaled) for the 000-hour analysis of the most recently published WaveWatch-III wave forecast. The main RCA sites are superimposed (see legend). Wave height and direction at the nearest grid point to each RSN site is displayed in the lower left below the plot. In most cases the distance between a site and its nearest model grid point is less than 6 nautical miles.
Below: Static maps (like that above) for the remaining 48 hours of the present forecast at 3-hour intervals.
Note: WW3 forecasts are available within 5 hours of model run time. This is due to the length \
of time NOAA takes to upload the most recent WW3 runs.