Current GFS Forecast
Most recent weather forecast plots.
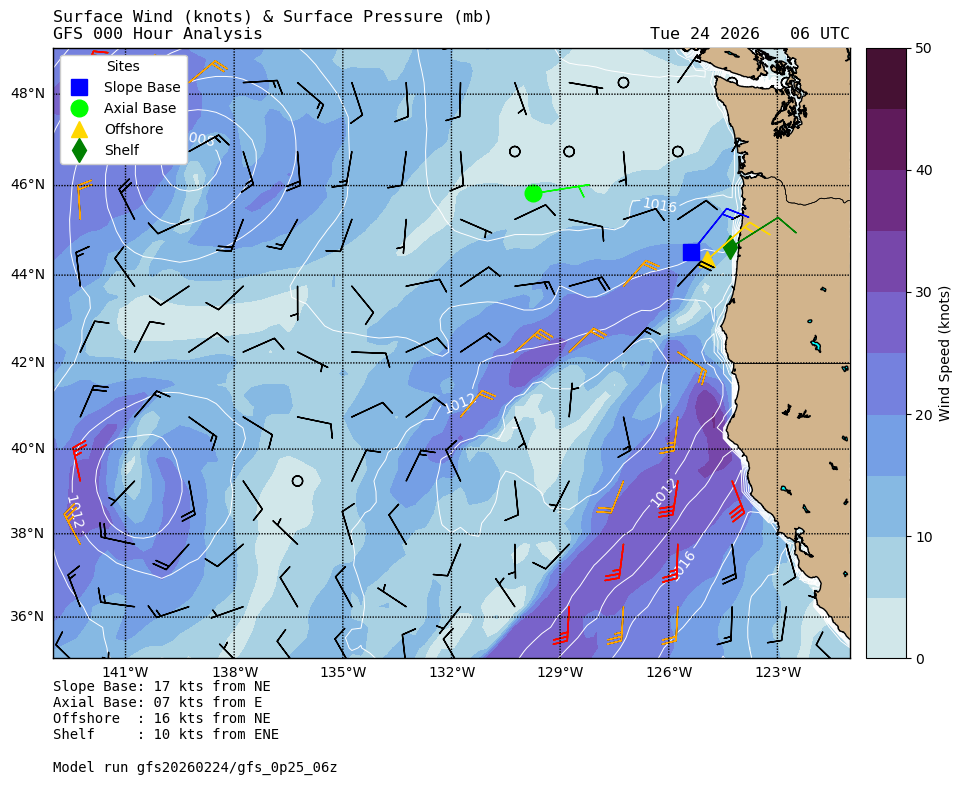
The image below shows a map of surface wind speed (coloring), wind speed vectors (barbs), and surface pressure (white contours; labeled) for the 000-hour analysis of the most recently published NOAA/NCEP Global Forecast System weather forecast. The main RCA sites are superimposed (see legend), and a wind barb indicating the wind speed and direction from the nearest model grid point to each site is placed at the location of the site. In most cases, the distance between a site and its nearest model grid point is less than 6 nautical miles). Wind barbs indicating wind speeds between 20-25 knots are shown in orange, while winds over 25 knots are shown with red barbs (to indicate less than ideal conditions).
Below: Static maps (like that above) for the remaining 48 hours of the present forecast at 3-hour intervals.
Note: GFS forecasts are available within 5 hours of model run time. This is due to the length \
of time NOAA takes to upload the most recent GFS runs.